What is Sologic Root Cause Analysis?
The Sologic method is built on the principle that causal relationships exist for all events and can be graphically modeled by using evidence-based inputs along with conditional logic. This model provides a stable foundation upon which the investigation team develops a comprehensive understanding of the problem. This leads to identification of effective solutions including immediate corrective actions as well as long-term, sustainable solutions. Requiring evidence-based inputs prevents conclusions based on conjecture and hidden agendas while reconciling different viewpoints. This ensures that all stakeholders understand the problem in the same way and to the same degree.Sologic root cause analysis minimizes personal bias and maximizes analytical thinking. Both are critical to gaining leadership support and resources for solutions. It unites the team around a common purpose, process, and language.
How Does Sologic Root Cause Analysis Work?
The Sologic RCA process has 5 Steps:

Step 1: Gather and Manage Data/Evidence:
All RCAs are driven by evidence. Therefore, the first step is to gather, secure and manage the data relevant to the problem. Evidence can be found in many forms. Pictures/video, witness/expert statements, documentation, laboratory samples, computer log files, diagrams/schematics are all examples of potential sources of evidence.
Step 2: Create the Problem Statement:
The Problem Statement documents:
The Focal Point: The issue being analyzed and the focus of the investigation. Typically the focal point is the undesirable outcome that we wish to prevent from happening in the future. However, events with positive outcomes can also be examined. In those cases, the goal is to replicate the outcome rather than prevent it.
When: The time, date, and any unique timing aspects of the problem.
Where: The location of the problem.
Actual Impact: The actual impacts of the problem, including safety, environmental, operational, costs, lost profits, fines, and any other adverse impacts.
Potential Impact: Potential impacts are those which did not occur, but had a high probability of materializing. The causal relationships found in near-miss events share most of the causes found in direct hits. Examining events with high potential impact will identify proactive solutions that prevent future problems.
Frequency: Identifies how often this problem has occurred in the past. Frequency acts as a multiplier. For example, a small problem that happens multiple times per week will result in a large cumulative impact.
The Problem Statement is brief but comprehensive. It gathers all the relevant information about the problem and presents it in a concise format (about one page of detailed facts) that informs the reader with the business case and why the problem needs to be solved. The Impact section establishes how much time and money should be spent on the RCA and its solutions.
Step 3: Analyze Cause and Effect
The Cause and effect analysis examines the causes of the Focal Point. We analyze cause and effect for two reasons: 1) It develops a detailed, evidence-based understanding of the event, and 2) It leads to effective solutions by providing innovative opportunities to eliminate or control the causes of the problem.
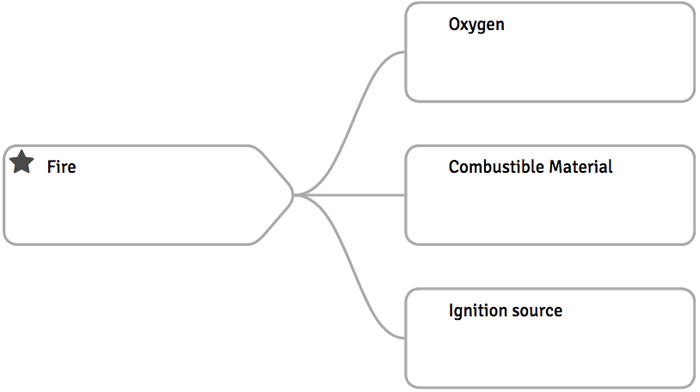
A basic premise of cause and effect analysis is that effects are generally the result of multiple causes. A fire, for example, has three causes: Oxygen, combustible material, and an ignition source. Each cause is necessary in order for the fire to exist. And the group of causes together is sufficient to cause a fire – nothing else is needed. Each of the causes of the fire has subsequent causes as well. It can all become quite confusing – therefore we employ a cause and effect chart to help us keep track.

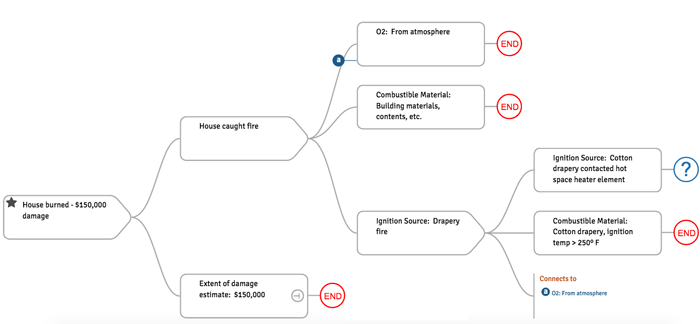
The example above is very simple – but if we add some detail to the chart, the picture becomes clearer.

Every cause identified has its own causes. Theoretically, the cause and effect chart for even a simple event is limitless. But practically, we choose to limit branches when we believe no additional value will be found in continuing a line of questioning. In the example above, the Oxygen cause branch ends because there is no utility in this case to continue further. Now, if the fire took place in the vapor space of a petroleum storage tank that was supposed to be free of oxygen, we would absolutely continue to investigate the source of the oxygen.
Step 4: Generate Solutions
The cause and effect chart provides the platform for solutions. We solve problems by controlling, altering, or eliminating causes. Therefore, if the cause and effect chart accurately models the causes of the problem, controlling those causes eliminates future similar events (or greatly reduces probability).
One common misconception is that there is a single root cause for any given event. Rarely is this the case. Robust solution strategies eliminate causes from different paths on the cause and effect chart. Diversification of solutions helps to reduce risk of recurrence to a lower level than can be achieved by implementing single solutions.
Consider the arc of automotive safety over the past 25 years. There are now many safety devices working to keep the occupants safe. Safety devices have evolved from lap belts to three-point restraints, air bags, energy-absorbing structures, proximity radars, anti-lock and/or automatic braking, and a host of other protective systems. At least one car (Tesla) now has full autopilot. In another 25 years, few of us will likely still be driving at all. Any one of these solutions on its own reduces risk. But when they all act together, it makes for a much safer driving experience.
At Sologic, we challenge our teams to go beyond the quick fixes that get things back on track in the short-term, but allow risks to trend back to their pre-event levels over the long-term. We compare the cost of these solutions to the value of the problem in order to present leadership with a set of solutions that will not only be effective, but also provide a positive return on investment.
Step 5: Produce the Final Report
Once the analysis is complete, we assemble a final report. The final report is the communication vehicle for a broader audience so that others can recognize and mitigate risks in their areas. The report also becomes the ‘lesson learned’ document enabling the new knowledge to be shared with future employees.
You can find many example reports in the RCA Templates and Examples section of our website.